[ad_1]
View
- Bitcoin’s dramatic overnight fall from $9,200 is telling a tale of buyer exhaustion.
- A break below Sunday’s low of $8,461 would invalidate the recent bullish trend and could yield a drop to $8,200-$8,000. Dips could be short-lived as the longer duration charts are still reporting bullish conditions.
- Bitcoin may make another attempt to pass the 200-day average at $9,027 if support at $8,461 continues to holds ground.
Bitcoin’s price rally is looking tired following Sunday’s sudden drop from above $9,000. Even so, the bias remains bullish with support near $8,460 still intact.
The top cryptocurrency by market value ran past the 200-day average at $9,040 during Sunday’s Asian trading hours, raising prospects of a rise to the next major resistance at $9,400.
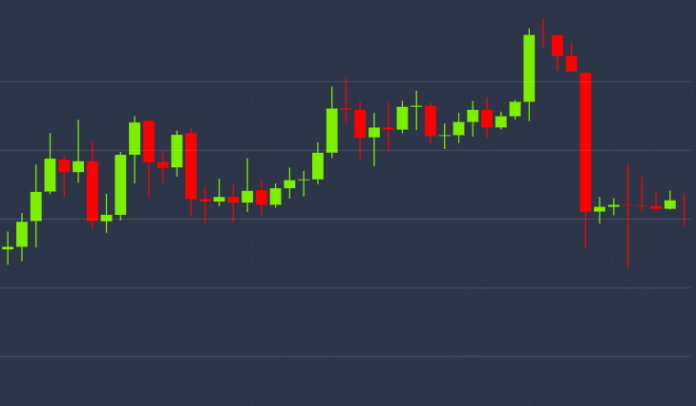
The ascent, however, was cut short near $9,200 and prices fell sharply by 8 percent to $8,461, according to CoinDesk’s Bitcoin Price Index. The majority of the drop occurred around 23:00 UTC.
Since then, the cryptocurrency has been largely confined to a trading range of $8,460 to $8,750.
With the sharp pullback from near $9,200, bitcoin engulfed the price action seen in the previous four trading days. This type of market action after a notable rally or at multi-month highs is indicative of temporary bullish exhaustion.
What matters now is the survival of $8,461 – the level at which the pullback looks to have halted in the last 20 hours. The same level saw bitcoin turn lower on Jan. 8.
Acceptance under that key support would confirm
bullish exhaustion and terminate the short-term uptrend.
At press time, bitcoin is trading near $8,640,
representing a 4 percent slide on a 24-hour basis.
Daily chart
Bitcoin charted a big bearish outside day candle on Sunday. These occur when the day begins with optimism but ends on a negative note, engulfing preceding day’s price action.
While the pattern is considered a bearish
signal, traders usually wait for confirmation in the form of follow-through,
preferably a move below the low of the candle.
Should Sunday’s low of $8,461 be breached, chart-driven selling could gather pace, yielding a deeper drop to last Tuesday’s low of $8,104.
However, if the support holds ground, the bulls will likely have scope to inch back toward the 200-day average, currently at $9,027.
Hourly chart

Bitcoin has dived out of the ascending trendline rising from Jan. 3 and Jan. 10 lows in favor of the bears.
The pullback looks to have legs as the breakdown was backed by the highest selling volume (red bar) since Dec. 16.
So, a drop through the support at $8,461 can’t be ruled out. That would expose the next support located at $8,200 (horizontal line) and the psychological level of $8,000.
Weekly chart

Bitcoin jumped 6 percent last week, cementing the breakout from the long-term descending channel kicked off by the preceding week’s 11 percent gain.
Further, the 5- and 10-week averages have produced a bullish crossover and the MACD histogram is about to cross over to bullish territory above zero.
So, with the longer duration chart reporting bullish conditions, any dip to $8,200 or lower, may be short-lived.
The cryptocurrency will remain on track to test October’s high of $10,350, as long as the channel breakout is valid.
Disclosure: The author holds no cryptocurrency assets at the time of writing.
Disclosure Read More
The leader in blockchain news, CoinDesk is a media outlet that strives for the highest journalistic standards and abides by a strict set of editorial policies. CoinDesk is an independent operating subsidiary of Digital Currency Group, which invests in cryptocurrencies and blockchain startups.
[ad_2]


